LINE CHART ELEMENT
Posted by 1 1 on
With the Line widget you can make a chart of your datasource. |
|
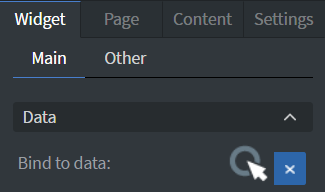 |
You can use the Bind to data tool to select your Datasource.
See more about: Data binding. |
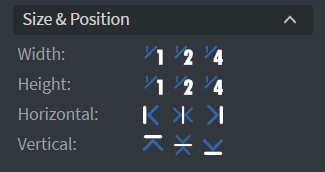 |
In the Size & Position Menu you can select the width, height, and placement of your widget quickly. See more specified information about: Size&Position. |
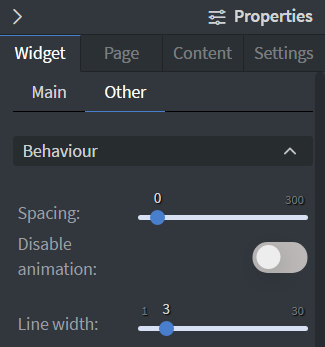 |
In the Behavior Menu you can set the spacing and the depth of your chart. |
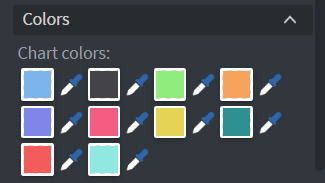 |
In the Colors Menu you can set the color of the lines individually. |
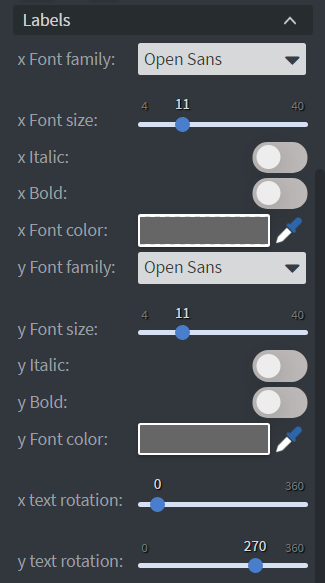 |
In the Labels Menu you can select the font family, size, and style of your bar labels on both axis.
You can set the text rotation as well to both axis. |
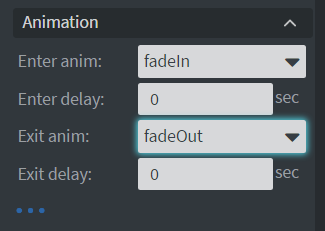 |
In the Animation Menu you can choose the enter and the exit animation of your widget.
See more specified information about: Animation. |