PIE CHART WIDGET
Posted by 1 1 on
With the Pie Chart widget you can display values from a datasource with a pie chart. |
|
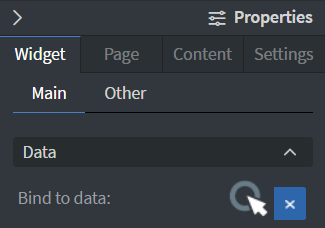 |
You can use the Bind to data tool to select your Datasource. See more about: Data binding. |
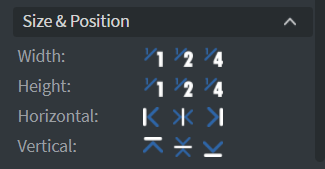 |
In the Size & Position Menu you can select the width, height, and placement of your widget quickly. See more specified information about: Size&Position. |
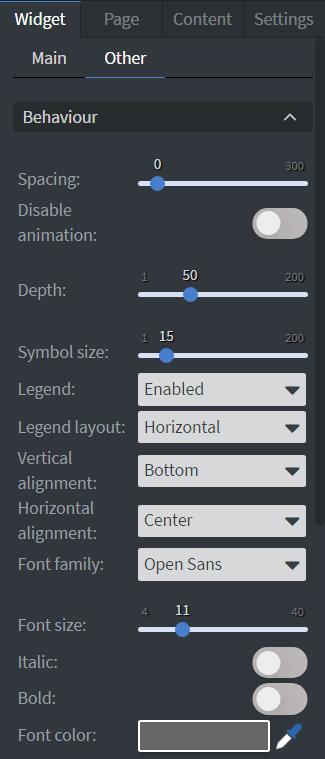 |
In the Behaviour Menu you can set the spacing, depth, and size of the symbols.
You can choose to display or not to display your legend. You can set the layout as well as the vertical and horizontal alignment of the legend. You can also set the font family, size, style, and color of the legend. |
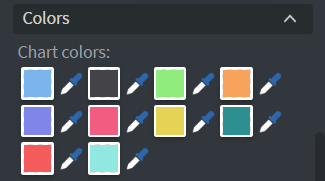 |
In the Color Menu you can set the color of the pie pieces individually. |
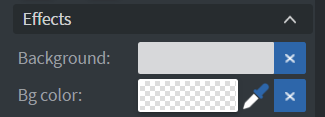 |
In the Effects Menu you can select a background image or color to your widget. |
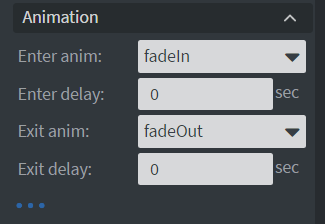 |
In the Animation Menu you can choose the enter and exit animations of your widget.
See more specified information about: Animation. |